Original dataBrand stacksEmail & SMSReviews
We scanned 3,797 DTC storefronts. Here's what actually runs them.
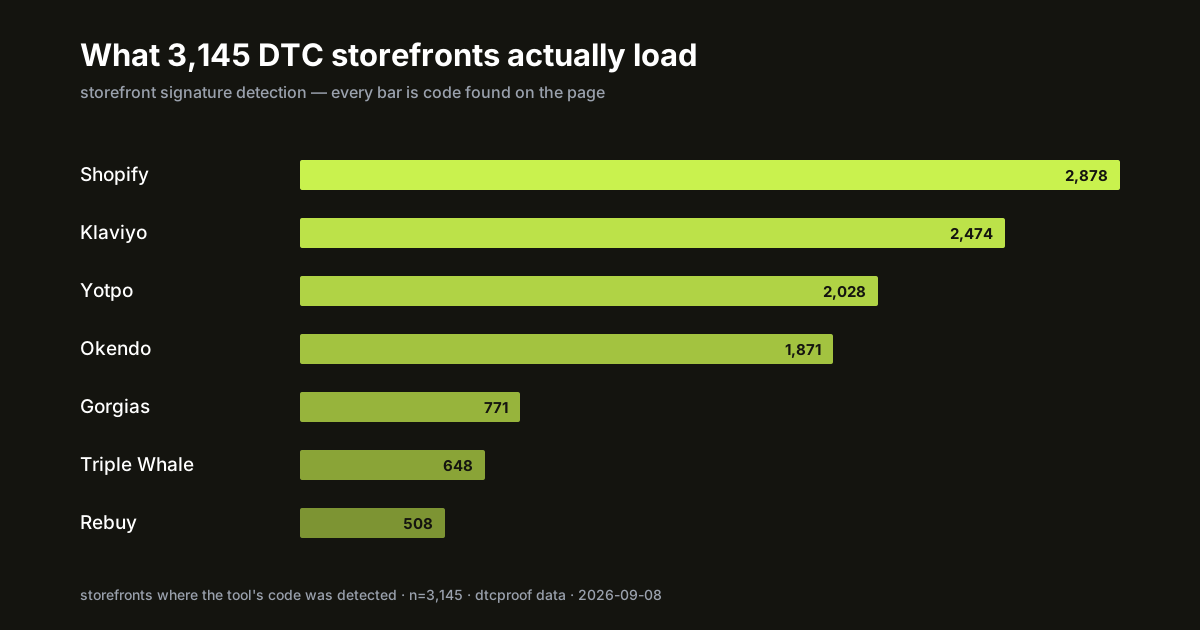
Updated 2026-08-20: fourth edition. It began with 59 hand-picked brands, grew to 1,710 detected storefronts, and now covers 3,797 scanned brands of which 3,145 expose a detectable stack. Sources: our curated seed list, two DTC directories, and — new this scan — a consumer-sentiment ranking of 350 pet brands, chosen deliberately because it selects for being loved rather than for being an indexed DTC operator. For the first time the headline numbers moved, and where they moved is the finding.
Vendor marketing tells you who should use a tool. Storefront code tells you who does. We scan the public storefronts of 3,797 DTC brands across eleven verticals — from Glossier and Gymshark to the long tail of independent labels — and match script signatures for 60+ ecommerce tools. 3,145 of them expose a detectable stack. No surveys, no vendor claims. Just code.
The raw numbers live in the DTC stack report, refreshed with every scan; every per-brand detection is browsable under brand stacks.
The headline numbers
| Tool | Layer | Detected on | Share of 3,145 |
|---|---|---|---|
| Shopify | Platform | 2,875 | 91% |
| Klaviyo | 2,475 | 79% | |
| Yotpo | Reviews | 2,027 | 65% |
| Okendo | Reviews | 1,871 | 60% |
| Gorgias | Helpdesk | 777 | 25% |
| Triple Whale | Analytics | 646 | 21% |
| Judge.me | Reviews | 573 | 20% |
| Rebuy | Upsell | 513 | 16% |
| Attentive | SMS | 483 | 15% |
| Junip | Reviews | 291 | 9% |
| Postscript | SMS | 257 | 8% |
| Northbeam | Analytics | 226 | 8% |
Shopify is the default — but only above a certain size
2,875 of 3,145 detectable platforms are Shopify — 91%, after three straight measurements at 92–93%. The dip is not the market moving; it is us sampling somewhere new. This scan added 229 brands drawn from a consumer-sentiment ranking rather than a DTC directory, and inside that cohort Shopify runs 76% while WooCommerce runs 14% — seven times its rate in the rest of the index.
That is the finding, not the noise: the Shopify monoculture is a property of the indexed tier. Among brands established enough to appear in a DTC directory it is overwhelming and stable. Reach below that line, into brands people love but directories don’t list, and a real platform mix reappears.
Email: the moat that doesn’t move
Klaviyo appears on 81% of detectable storefronts — 76% on the original curated cohort, 82% at 1,710, 81% at 3,145. Three samples, one answer. The challengers at index scale: Omnisend on 198 stores (6%) — now slightly ahead of Mailchimp’s 199, whose installs remain legacy-shaped (just 13 of the top-300 brands). The SMS layer above it: Attentive 483 vs Postscript 257, both overwhelmingly running alongside Klaviyo. The full email-layer analysis has the tiering detail.
Reviews: Yotpo’s empire grew — and so did the paradox
The review layer consolidated further at scale: Yotpo is on 66% of the entire index and Okendo on 61% (many stores run components of both suites). Judge.me — owner of the App Store’s best listing, 5.0 ★ across 43,000+ reviews — appears on 573 storefronts, 20%. Notably, its share rose as we added longer-tail brands (15% → 20%), exactly what the segmentation thesis predicts: Judge.me’s population lives below the established tier, and the deeper the index reaches, the more of it becomes visible. The review-app paradox unpacks why the App Store and the storefronts disagree.
The layers that became visible at scale
Analytics: Triple Whale is on a fifth of all storefronts and Northbeam on 7% — the post-iOS14 attribution wave, measured. Helpdesk: Gorgias on 25%, with no meaningful challenger detected. Upsell: Rebuy at 16% confirms its category leadership. Stack depth: 1,557 brands — 50% of the detectable index — run six or more detected tools, up from 39% on the smaller sample. Part of that jump is better instruments: on 2026-08-07 we added signatures for five layers we had been blind to (pop-ups/CRO, site search, translations, mobile app builders, retention extras), which surfaced 898 tool installs that were always there and never counted. The fully-tooled retention machine isn’t an outlier; it’s the median.
What we still barely find
Loyalty programs remain sparse relative to their marketing noise — 358 storefronts, 12%. Translations (60, 2%) and site search (152, 5%) are rarer still. Quiz builders, feature-voting widgets, most of DTC Twitter’s “must-haves”: rare. The gap between discourse and deployed code has now stayed wide at 60× the original sample size.
Method, limits, and how to cite this
Signature detection reads public storefront HTML — homepage plus one product page — for vendor script and CDN fingerprints. Presence is strong evidence; absence proves nothing (server-side tools, checkout-only apps, and headless builds escape the scan). Confidence levels are shown per detection on each brand page.
Cite as “DTC Proof storefront detection, 2026-08-20, n=3,145 detected of 3,797 scanned”. The scan re-runs weekly; this post is a snapshot, the report is the living version.
FAQ
Why do the numbers barely move as the index grows? Because the original findings weren’t small-sample artifacts. Across five measurements Shopify has stayed in a 91–93% band and Klaviyo inside six points. When numbers do move, they move for a readable reason: this scan’s dip in both came entirely from adding a cohort sampled below directory-indexed DTC, where the same tools are genuinely less dominant. The tools that rose (Judge.me, WooCommerce, Appstle) are exactly the ones the segmentation thesis predicts you find as you reach deeper into the tail.
Could a brand use a tool you didn’t detect? Yes — that’s the central limit of signature detection. Presence is near-certain; absence is silence, not denial.
Do vendors pay to appear in this data? No. No vendor pays for placement anywhere on this site, and we have no affiliate relationships in this dataset. Pipeline details: methodology.