Helpdesk & CXOriginal dataBrand stacksBuying guides
One tool runs 96% of the DTC helpdesk layer. Its merchants rate it 4.2.
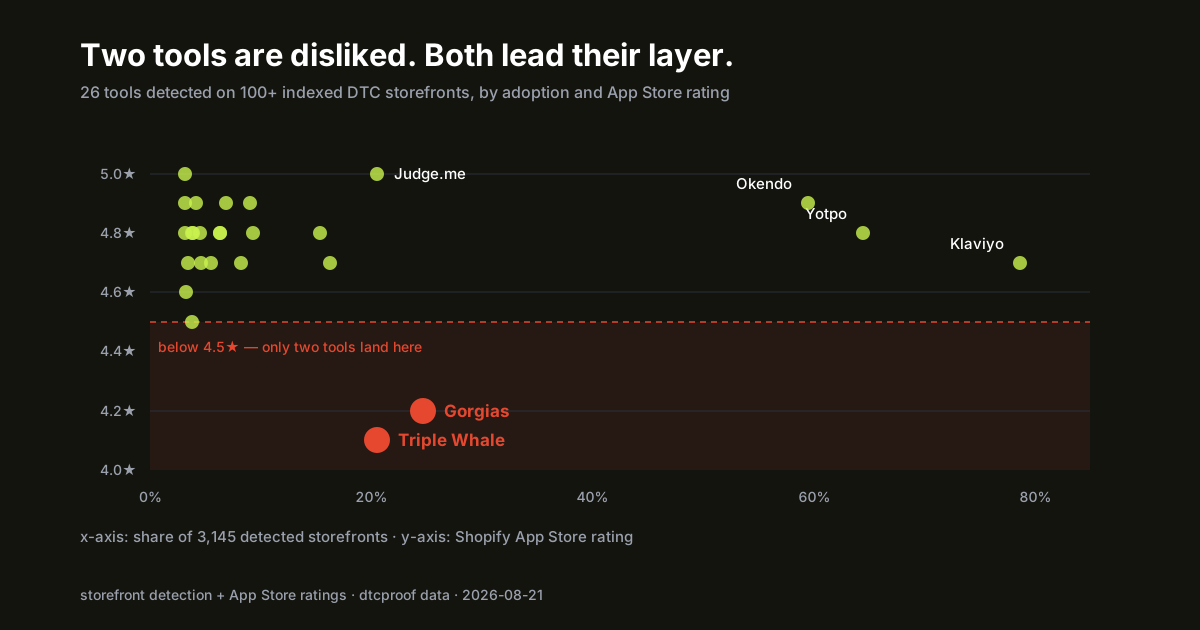
Twenty-six tools in our index are detected on 100 or more DTC storefronts. Twenty-four of them rate 4.5★ or better on the Shopify App Store. Two don’t — and both of them lead their own layer.
The lower of the pair is Triple Whale at 4.1★, which holds 69% of detected analytics installs. The other is Gorgias at 4.2★, which holds 96% of every helpdesk install we detect — the most concentrated layer of the fifteen we track.
Two tools, same shape: the layer’s near-monopolist is also the layer’s least-liked product. It shows up nowhere else in the 110 products we track — every other layer’s leader is also well-rated. And you can only see it by putting adoption and sentiment on the same chart. App Store rankings alone won’t, because a rating tells you how people feel, not whether the unhappy ones can leave. Gorgias is the sharper case, so the rest of this piece follows it.
The layer in numbers
816 of our 3,145 detected storefronts (25.9%) run a helpdesk we can see. Here is how those installs split:
| Tool | Detected on | Share of helpdesk installs | App Store rating | Reviews |
|---|---|---|---|---|
| Gorgias | 777 | 95.1% | 4.2 ★ | 618 |
| Tidio | 40 | 4.9% | 4.8 ★ | 1,247 |
| Richpanel | not detected | — | 4.7 ★ | 121 |
| Intercom | not detected | — | 4.6 ★ | 16 |
| Re:amaze | not detected | — | 4.5 ★ | 142 |
| Zendesk | not detected | — | 3.5 ★ | 77 |
| tawk.to | not detected | — | 3.6 ★ | 55 |
Concentration index (HHI) for the layer: 9,069 out of a 10,000 maximum. For scale, US antitrust guidelines call any market above 2,500 “highly concentrated.” The email layer, which everyone describes as a Klaviyo monopoly, is less concentrated than this one.
Two caveats we’d rather state than bury. Chat widgets that load server-side or behind a tag manager escape a storefront scan — presence is strong evidence, absence is silence, and some of the 2,329 storefronts with no detected helpdesk certainly run one. And 4.2★ across 618 reviews is not a bad rating in absolute terms; it’s only remarkable next to the 4.5–5.0 that twenty-four of the twenty-six comparably-adopted tools earn.
Why concentration and dissatisfaction can coexist
Normally a leader this dominant is also well-liked — that’s how it got dominant. Klaviyo is at 79% and 4.7★. Yotpo is at 65% and 4.8★, Okendo at 60% and 4.9★. The helpdesk layer breaks the pattern, and the mechanism is switching cost.
A review app is a widget: swap the vendor, re-import the reviews, done in an afternoon. A helpdesk is where your team lives eight hours a day, with years of ticket history, macros, tags, routing rules, and — the part that actually locks the door — bi-directional write access into Shopify, so agents edit orders, issue refunds and manage subscriptions without leaving the inbox. Replacing that isn’t a purchase, it’s a data-migration project with a retraining plan attached. Gorgias is also installed for merchants by agencies as part of a paid engagement, which means the buying decision often isn’t made by the people who later rate the app.
Adoption skews to exactly the tier you’d predict: 86 of our top-300 brands run Gorgias, versus 5 running Tidio. The bigger the operation, the more locked-in the layer.
It is worth noting that Triple Whale fits the same mould. Attribution platforms accumulate months of historical modelling that does not port to a competitor, so a merchant who dislikes the product still loses something real by leaving. Wherever switching costs are high, rating and share stop tracking each other.
What merchants actually complain about
We mine themes from each app’s most recent App Store reviews. Gorgias’s complaint list, ranked by how often the theme appears:
- Weak support experience — slow or hard-to-reach human support, especially during onboarding and trials.
- AI setup and reliability — the AI agent needs careful training and oversight; badly configured, it produces bad outcomes.
- Bugs and missing features — instability, absent basics, thin documentation, slow roadmap.
- Pricing and value — cost and paid AI add-ons hard to justify against alternatives.
- UI and workflow disruption — long-time users unhappy with recent interface changes.
Note the ordering, because it cuts against the obvious narrative: the loudest complaint is support quality, not price. Merchants who buy a support tool and then can’t get support have a specific kind of grievance, and it appears more often than billing does.
The praise themes are real too, and they’re the reason the share is 96%: reviewers consistently say the AI resolves routine tickets and first-touch questions well, and that the Shopify-connected workflows genuinely cut manual work. This is not a bad product. It’s a product whose customers are stuck with its weaknesses.
The pricing model, from the vendor’s own page
Our last capture of gorgias.com/pricing (2026-07-16) contains no public price at all — every tier is quote-based. What the page does disclose is the shape of the meter: helpdesk plans scale on tickets per month, from 50 to 5,000, and the AI agent “charges only when it resolves a conversation.”
Read those two sentences together. The ticket counts toward your plan volume and the AI resolution carries its own charge. That’s a defensible model — you pay for outcomes — but it prices in the direction opposite to what DTC actually needs, because ticket volume spikes precisely when margins are thinnest: Black Friday, a shipping delay, a viral product, a recall. A cost line that scales with your worst week is a different risk than a flat SaaS seat, and merchants who model it as the latter get surprised.
The practical consequence is that you cannot price-compare this layer from public pages, which is unusual — most categories we track publish at least a starting tier. Get the quote in writing, ask for the overage rate per ticket beyond plan, and ask specifically whether an AI-resolved conversation is billed once or twice.
The challengers exist — and they out-rate the incumbent
The gap has not gone unnoticed by builders. Checking the Shopify App Store directly today (2026-08-09):
- Redo — 4.9★ across 660 reviews
- Commslayer — 4.9★ across 188 reviews, from a team that shipped a well-regarded analytics app before this one
- Tidio — 4.8★ across 1,247 reviews, the most-reviewed helpdesk in the category
Every one of them out-rates Gorgias. None of them is anywhere near its footprint — Tidio, with twice Gorgias’s review count, appears on 40 indexed storefronts against 777.
This is the “loved but unused” pattern our data keeps producing, and it repeats across layers: Appstle at 5.0★ and 8,129 reviews reaches 2.6% of indexed brands; Smile.io at 4.9★ and 4,176 reviews reaches 1.6%. Excellent App Store standing measures the whole Shopify ocean. Our index measures the brands with enough traction to be tracked — and at that tier, incumbency beats affection.
What to do with this if you’re buying
Under roughly 100 tickets a month: you don’t need this layer yet. Shopify Inbox is free and adequate, and the money is better spent on the email layer, where the returns are measurable.
Roughly 100–800 tickets a month: this is the genuinely underserved band, and it’s where the challengers are worth a real trial. You’re above what free tools handle comfortably and below the volume at which Gorgias’s depth earns a quote-based contract. Trial two, migrate whichever wins while your ticket history is still small enough to move.
Above ~800 tickets a month, or already running agencies and a support team: Gorgias is the default for defensible reasons, and 86 of the 300 biggest brands in our index agree. Negotiate the meter, not the sticker: cap the overage rate, get the AI-resolution charge in writing, and model November at 4–5× a normal month before you sign.
Whenever you sign: the switching cost is the product. Whatever you choose, assume you’ll live with it for three years, and weigh the export path — ticket history, macros, tags — before the integration depth, not after.
Method note
Storefront signature detection, n=3,145 detected of 3,797 indexed brands, re-scanned 2026-08-20, re-run weekly; homepage plus one product page per store. App Store ratings and review-theme mining from each app’s public listing; challenger ratings fetched live 2026-08-09. Pricing quoted from our dated capture of the vendor’s own pricing page. Concentration measured as the Herfindahl–Hirschman Index over detected installs within the layer. Cite as “DTC Proof storefront detection, 2026-08-20, n=3,145.” Full method and limits: methodology.
No vendor pays for placement anywhere on this site, and we hold no affiliate relationship with any product named here.
FAQ
Does 96% mean Gorgias has 96% of the helpdesk market? No — it means 96% of the helpdesk installs we can detect on indexed DTC storefronts. Server-side and tag-manager-loaded widgets are invisible to us, and the indexed-DTC population is not the whole Shopify market. It is a real measurement of a real, well-defined population, not a market-share estimate.
Is 4.2★ actually bad? On its own, no. In context, yes: only one tool in our index detected on 100+ storefronts rates lower (Triple Whale, 4.1★), in a field where 4.7 is ordinary. The helpdesk layer’s median rating, 4.5, is tied with translations for the lowest of the fifteen layers we track.
Why doesn’t the low rating show up as lost share? Because ratings are written by everyone who tried the product, while share is held by everyone who can’t easily leave. That divergence is the finding.
Should I switch off Gorgias? Not on this data alone. Switching is expensive and the product does the core job well. Use this as leverage at renewal and as a reason to trial alternatives before your ticket history gets large — not as a migration trigger.
Tracked pricing, feature matrices and review themes for the whole layer: best helpdesk apps for DTC.